Running live, every 15-minute Bitcoin market · simulated
The bot that trades the leaderboard's three best signals
Every 15 minutes it watches the three signals that have done best on markets they had never seen, buys the first one that fires, and posts the trade here, win or lose. With Pro, the SettleMath Bot app places the same trades on your own Kalshi account.
- Every trade public since
- Real prices, fees included
- Checked against the order book
The record is simulated. Trading event contracts can lose money.
Every trade since , added up
998 trades at the bot’s own stakes, simulatedLive: the bot’s buys
A notification on your phone or computer with the side, the price and the time left, even with this page closed. Simulated: the trade and its result are listed here after the market settles. On an iPhone, add SettleMath to your Home Screen first (Safari: Share, Add to Home Screen) and turn this on from there.
New · Ethereum
The ETH bot
+$72.70 since Nov 16, 8:01 PM CT · 26 trades, 17 won, 9 lost
The same rules on Ethereum's 15-minute markets: the ETH leaderboard's top 3, $100 a trade, any price and time left. Building its record: the app can copy it once its own trades reach 30 and hold up (26 of 30). Simulated, fees included.
The ETH bot New
Simulated at live prices, fees included+$72.70
since Nov 16, 8:01 PM CT, 26 trades, 17 won, 9 lost, $100 a trade
Trading now: the ETH leaderboard's top 3
- None this market: the next ranking's top 3 take over at the next market's open.
Building its record: the SettleMath Bot app can copy it once its own trades from its start reach 30, ahead and by at least one standard error (26 of 30 so far). Until then it can't be ticked in the app; its trades are listed here.
The ETH leaderboard →The whole leaderboard and the simulator →
Its latest trades
| Market | Signal | Bought | Result | Profit |
|---|---|---|---|---|
| Nov 17, 4:00 PM | #1 signal | Down at 62¢ | won | +$57.07 |
| Nov 17, 1:15 PM | #1 signal | Down at 64¢ | lost | −$99.74 |
| Nov 17, 1:00 PM | #1 signal | Down at 67¢ | lost | −$99.40 |
| Nov 17, 10:45 AM | #1 signal | Down at 59¢ | won | +$64.46 |
| Nov 17, 9:45 AM | #1 signal | Down at 66¢ | won | +$47.67 |
| Nov 17, 9:30 AM | #1 signal | Down at 65¢ | lost | −$99.89 |
| Nov 17, 9:15 AM | #1 signal | Down at 61¢ | won | +$59.36 |
| Nov 17, 9:00 AM | #1 signal | Down at 62¢ | won | +$57.07 |
| Nov 17, 8:45 AM | #1 signal | Down at 51¢ | won | +$89.30 |
| Nov 17, 8:30 AM | #1 signal | Down at 64¢ | won | +$52.26 |
| Nov 17, 8:15 AM | #1 signal | Down at 63¢ | won | +$54.46 |
| Nov 17, 7:30 AM | #1 signal | Down at 61¢ | lost | −$99.64 |
| Nov 17, 6:00 AM | #1 signal | Down at 66¢ | lost | −$99.33 |
| Nov 17, 5:30 AM | #1 signal | Down at 67¢ | lost | −$99.40 |
| Nov 17, 5:00 AM | #1 signal | Down at 68¢ | won | +$43.58 |
| Nov 17, 4:15 AM | #1 signal | Down at 62¢ | won | +$57.07 |
| Nov 17, 3:30 AM | #1 signal | Down at 63¢ | won | +$54.46 |
| Nov 17, 1:45 AM | #1 signal | Down at 61¢ | won | +$59.36 |
| Nov 17, 1:00 AM | #1 signal | Down at 63¢ | lost | −$99.54 |
| Nov 17, 12:15 AM | #1 signal | Down at 58¢ | won | +$67.29 |
| Nov 17, 12:00 AM | #1 signal | Down at 68¢ | won | +$43.58 |
| Nov 16, 11:45 PM | #1 signal | Down at 60¢ | won | +$62.07 |
| Nov 16, 10:45 PM | #1 signal | Down at 64¢ | lost | −$99.74 |
| Nov 16, 9:15 PM | #1 signal | Down at 64¢ | lost | −$99.74 |
| Nov 16, 9:00 PM | #1 signal | Down at 67¢ | won | +$45.60 |
Hypothetical or simulated performance results have certain limitations. Unlike an actual performance record, simulated results do not represent actual trading. Also, since the trades have not been executed, the results may have under-or-over compensated for the impact, if any, of certain market factors, such as lack of liquidity. Simulated trading programs in general are also subject to the fact that they are designed with the benefit of hindsight. No representation is being made that any account will or is likely to achieve profit or losses similar to those shown.
How it picks its trades
Fixed rules, the same for everyone
- 1
Only signals that earned it
The Lab has tested hundreds of thousands of signals; the leaderboard keeps the few that held up and ranks them on markets they had never seen. The bot takes the top 3 with 30 or more fires since they were found, ahead on those markets; while fewer than 3 have that, signals still being tested (10+ fires, ahead) fill the empty places.
- 2
One buy a market, at the real price
Whichever of them fires first is the trade, at the asking price that second, with Kalshi's fee. Every trade is also checked against the order book a second later.
- 3
Any price, any time left
Since Nov 17 2026 it takes its first fire at whatever the price is and however long is left, and when fewer than 3 signals have earned a place, the best ones still being tested fill in. Its earlier trades stay as they were booked, under the limits it had then.
- 4
Every trade shown
Wins and losses, each at the asking price that second with Kalshi's fee, from its first trade on. A live-price simulation: nobody's money.
The SettleMath Bot app
Its buys, on your own Kalshi account
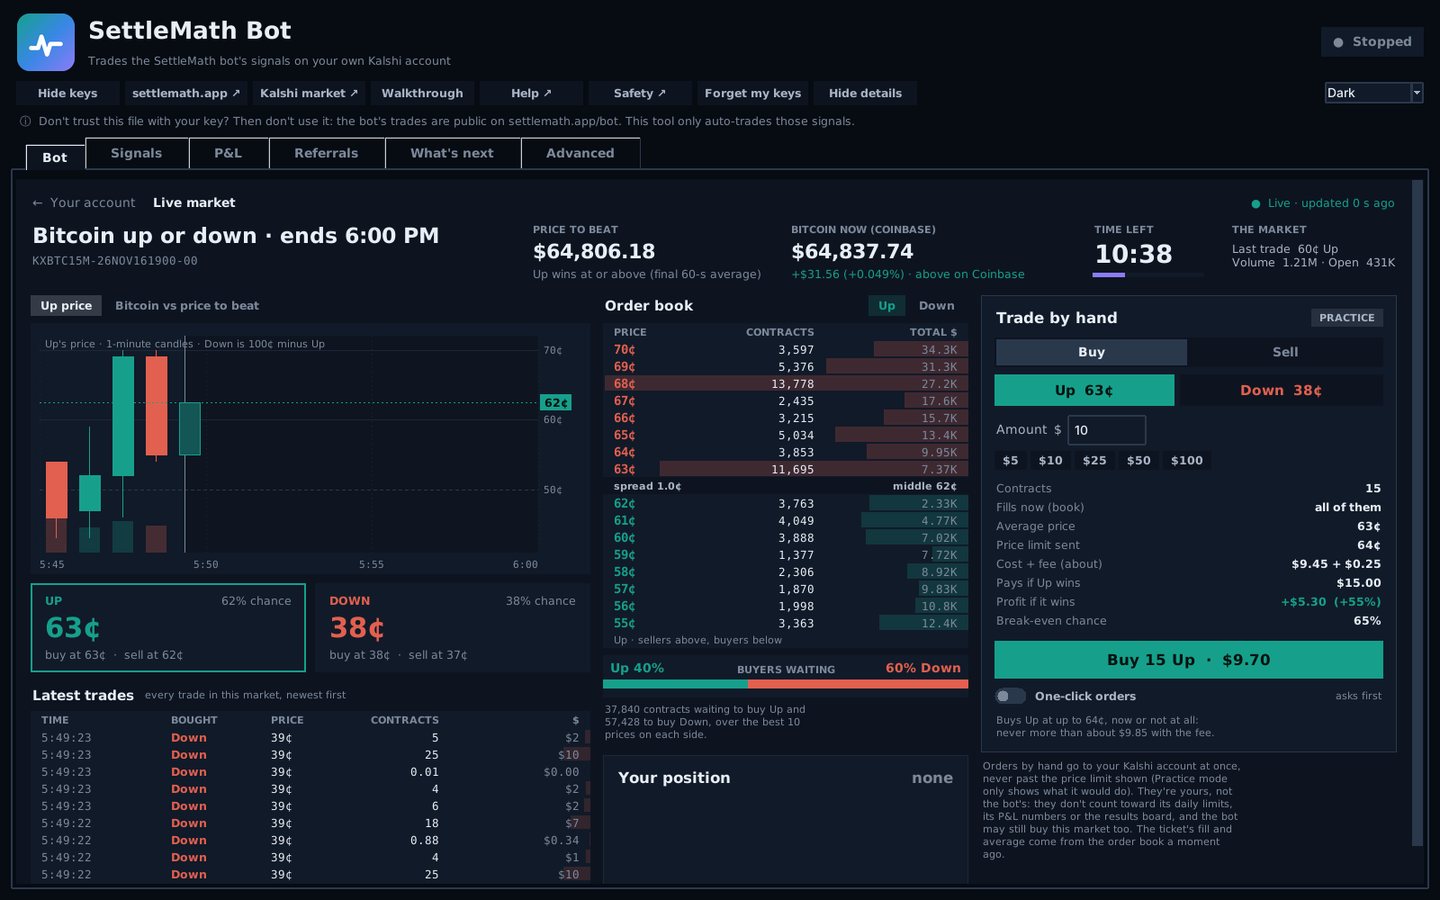
The app gets each buy the second the bot makes it and places it with your amount, inside your daily loss limit and profit target. Your keys stay on your computer. Practice mode first: it shows what it would buy and buys nothing.
At your amount
Pick an amount a trade and every number on this page is shown at that size, scaled from the bot’s own trades.
Day by dayevery day and week since it started
What to expecthow much a normal day swings, from its own record
What to expect
- 5 of its 15 finished days were red (33%). The average day: +$346.73.
- Its worst day was Nov 13: −$1,133.64; it was back above where it started that day 1 day later.
- 0 of its 2 finished weeks were red. It trades about every market, so single days swing a lot; it is built to be judged over weeks, not days.
From every day and week in its record (simulated; the bot’s own stakes are $80 to $150 a trade, and an amount a window scales each figure by the bot’s average stake, so it is approximate). Past results don’t promise future ones.
If you had followed it, exactlyyour amount, whole contracts, and how big to bet for your bankroll
If you had followed it, exactly
Your amount a trade, worked out trade by trade: whole contracts at the price the bot bought at, the fee included, over the trades it keeps. Simulated, like the numbers above.
Ways to trade the same signals, compared paper
Each line is what one way of trading the leaderboard would have made, starting from $0. Top 3 is the bot itself: the same trades as the calendar. The others pick from the same signals with the same rules, on paper, no money traded.
Counting started Nov 13, 10:46 PM CT; a day a way only saw part of says so, and so do the newer ones. Amounts follow your amount at the top of the page, like the calendar (a basket puts 30% of it into each of its buys).
- Top 10 basket +$192.98680 trades
- Master (48 h) +$60.76287 trades
- Top 3 (the bot) +$52.18185 trades
- Either-way basket −$216.19213 trades, since Nov 15, 2:46 PM
- Top 5 −$541.73214 trades
- Top 10 basket, one side −$546.99273 trades, since Nov 15, 2:46 PM
Each day, up or down
Swipe the table sideways for every way →
| Day (Central) | Top 3 (the bot) | Top 5 | Top 10 basket | Master (48 h) | Top 10 basket, one side | Either-way basket |
|---|---|---|---|---|---|---|
| Tue, Nov 17 | −$216.8518 trades | −$216.8518 trades | −$104.4622 trades | −$333.1521 trades | −$63.5618 trades | −$54.2816 trades |
| Mon, Nov 16 | −$362.4748 trades | −$293.2452 trades | −$232.50114 trades | −$92.0074 trades | −$121.41108 trades | −$65.8095 trades |
| Sun, Nov 15 | −$675.0261 trades | −$753.0166 trades | −$347.50315 trades | −$762.83131 trades | −$362.02147 tradesfrom 2:46 PM only | −$96.11102 tradesfrom 2:46 PM only |
| Total since it started | +$52.18 | −$541.73 | +$192.98 | +$60.76 | −$546.99 | −$216.19 |
Earlier days (2)
| Day (Central) | Top 3 (the bot) | Top 5 | Top 10 basket | Master (48 h) | Top 10 basket, one side | Either-way basket |
|---|---|---|---|---|---|---|
| Sat, Nov 14 | +$1,219.7754 trades | +$634.6274 trades | +$884.60224 trades | +$1,161.9957 trades | not started | not started |
| Fri, Nov 13 | +$86.754 tradesfrom 10:46 PM only | +$86.754 tradesfrom 10:46 PM only | −$7.165 tradesfrom 10:46 PM only | +$86.754 tradesfrom 10:46 PM only | not started | not started |
Simulated results do not represent actual trading. No representation is being made that any account will or is likely to achieve profit or losses similar to those shown. More on each one in the Lab’s paper tests →
Flip after a bad day testing
Once the bot’s day is down a set amount, every buy for the rest of that day goes to the other side instead. The amount is measured on the bot’s own day at its own size, so it is really a number of its trades: following it at $10 a trade, “down 6 trades’ worth” is about $60. Each line below is one amount, over the bot’s own trades since Nov 7 (11 days), with the other side priced from the market at the second the bot bought.
Not enough data. These numbers rest on only a few red days, and the amount was picked by looking at them, so they will very likely look better here than they do from now on. In the app it is off unless you pick it. Each day it uses the amount that had done best on the days before, and once it switches on it stays on until midnight Central. Live, it sits a market out when the result that would switch it on isn’t in yet, so a member’s day can differ a little from these. Use it at your own risk.
| Flip once the bot is | Total | Against the bot | Days it switched on |
|---|---|---|---|
| Down $400 on the day about 4 trades’ worth | +$480.13 | −$1,193.55 | 5: Nov 8, Nov 11, Nov 13, Nov 15, Nov 16 |
| Down $500 on the day about 5 trades’ worth | +$1,377.62 | −$296.06 | 3: Nov 8, Nov 13, Nov 15 |
| Down $600 on the day about 6 trades’ worth the app uses this today | +$2,744.73 | +$1,071.05 | 2: Nov 13, Nov 15 |
| Down $700 on the day about 7 trades’ worth | +$2,331.68 | +$658.00 | 2: Nov 13, Nov 15 |
| Down $800 on the day about 8 trades’ worth | +$1,724.17 | +$50.49 | 2: Nov 13, Nov 15 |
| Down $1,000 on the day about 10 trades’ worth | +$1,945.13 | +$271.45 | 1: Nov 13 |
| The bot as it is | +$1,673.68 |
Simulated results do not represent actual trading. No representation is being made that any account will or is likely to achieve profit or losses similar to those shown.
The rules, and the tests runningevery limit with why it was added, and what each idea would have done
Watches the top 3 signals on the SettleMath leaderboard that have earned it: 30+ fires on markets after they were found and ahead by at least one standard error on them, kept up to date after every update. In each market, whichever of them fires first at 85¢ or less (since Nov 5, 2026: from 20¢ to 85¢ with at least 5 minutes left; since Nov 8, from 25¢; since Nov 16, up to 70¢) is the trade, and nothing else trades in that market. $80 to $150 a trade: more as that signal's record gets stronger.
Since : no entry under 20¢ and none with under 5 minutes left. Over its first 254 trades, those two kinds won 1 of 16 and lost $655.76; the other 238 made $2,223.38. The limits were picked by looking at those same trades, so that split is the reason for them, not a forecast. Every earlier trade stays counted as it was.
Since : no entry under 25¢. Over the two weeks before, its trades at 20-25¢ won 1 of 14 and lost $680.68, and the top 3's first fires at that price won 1 of 9. Picked by looking at those same trades: a reason, not a forecast.
Since : no entry over 70¢ (it was 85¢). From Nov 10, on trades booked after the idea, its buys at 70¢ and up lost money while the cheaper ones made it: a loss at 80¢ costs the whole stake for a 20¢ win. A short test: a reason, not a forecast.
Since : no price floor, no top price, no trend guard and no 5-minutes-left rule: it takes its top 3's first fire at any price with any time left (the last few seconds aside), and while fewer than 3 signals pass the bar, the next ones with 10+ fires since found and ahead on them fill the empty places, marked still being tested. It trades far more often, and its swings are bigger. The limits above apply to the trades before then, which stay as they were booked.
Trend guard (since ): kept the bot out of 24 trades where the indicators, the crowd and Bitcoin's last minute had all turned against the side it would buy. Those trades would have made +$137.75 (if each had filled at its asking price) (12 won, 12 lost). It is off now, as the line above says.
Tests running (only trades booked from Nov 10, 5:15 PM count; nothing here changes a trade yet, and each is switched on only once its trades show it helps):
- A 70¢ cap (tested from Nov 10, 4:15 PM; the bot's own rule since Nov 16): at 70¢ and up 111 trades, −$344.80 (-3.2% on the money in); under 70¢ 270 trades, +$1,530.20 (+5.8% on the money in).
- 10 minutes or more left only: with 10+ minutes 261 trades, +$231.91 (+0.9% on the money in); with 5-10 minutes 101 trades, +$13.31 (+0.1% on the money in).
- No cool-down: on its 6 smallest-stake trades it made +$143.30; at full stake they'd have made +$270.92.
- More on cheap entries (×1.3 under 40¢ down to ×0.6 at 70¢ and up): 362 trades made +$245.22 (+0.7% on the money in); sized that way, +$496.61 (+1.6% on the money in).
- Bigger bets when whale orders agree, smaller when against (×1.3 / ×0.7, since Nov 10, 7 PM): with whales 188 trades made +$13.72 (+$7.31 sized up); against them 121 made −$313.31 (−$285.41 sized down).
- The 25¢ floor: kept it out of 12 first fires under 25¢ (1 won); bought, they'd have made −$367.92.
Fading check (live since Nov 10): a top signal whose last 40 fires lost 10% or more per dollar is benched until its form recovers, and the next one takes its place, so the bot follows what's working now, not just what worked. None benched right now. While benched, their fires would have made −$223.82 at $100 each (32 of 54 won).
Price paid against how often it wins
Over its last 600 trades the bot won 62% while paying 58¢ on average. A contract pays $1, so at that price, with Kalshi's fee, it needs to win about 60% of its trades to come out even: the edge is the gap between the two. A bot that buys at 90¢ needs to win more than 90%.
Also checked against the order book a second after each fire: +$4,688.44 filling only what was resting then (955 of 997 filled)
Why there are two sets of numbers (added Nov 2, 2026). A reader pointed out that "real ask prices" assumes the ask is still there when the signal fires, which is often exactly when it isn't: quotes get pulled and ask size vanishes the moment the price moves, and the fills are what's left after. Fair point, so we acted on it. Every trade is now also priced against the order book we record every second, from the book 1 second after the signal fired: only contracts that were actually resting there at no more than 2¢ above the fired price fill, level by level, each with its fee; if the ask was gone, there is no trade. Every trade of this version with a recorded book, back to its start, was priced this way.
It is still a simulation, and still a little kind to the bot: we see the top 10 price levels once a second, and another trader can take the same contracts first. The first numbers above take every fill at the quoted ask; the order-book numbers are the ones to judge it by.
Watching now: #1 A Lab signal found Nov 16, 8:56 PM (still being tested: in an empty place, under the bar) · $50 a trade · #2 A Lab signal found Nov 16, 9:07 PM (still being tested: in an empty place, under the bar) · $50 a trade · #3 A Lab signal found Nov 17, 11:10 AM (still being tested: in an empty place, under the bar) · $50 a trade
Earlier: Version 1 (Nov 1, 3:16 PM–9:46 PM CT, looser rules): 16 trades, 10 won, 6 lost, −$3.62 simulated. Its rules were replaced by these stricter ones; its trades stay counted here, never dropped.
Why it’s betting this way: Bitcoin fell 0.2% over the last 24 hours, and 50 of the last 96 markets settled Down. So 23 of the bot's 25 buys in that time were Down: it follows the signals that have been working, and in a falling market those bet Down. The Up bot follows the best Up signal meanwhile.
Why the bot buys one way right now
The bot doesn't choose a side. It copies the top 3 signals on the leaderboard, and a signal only gets there by winning on markets that came after it was found. When Bitcoin keeps drifting one way, the signals that keep winning are the ones that bet that way, so its buys go that way too.
That's on purpose: it bets the way that has been working and stays out of the way that hasn't. When the trend turns, a Down signal's edge fades, it loses its place after its losses, and Up signals that start winning climb in. The bot then follows them by itself; nobody has to flip a switch.
Up calls (the hollow green ▲ on the Live chart) come from the leaderboard's best Up signal, or while none holds up, from the scan's Up pick: its best Up rule in its latest check, which hasn't passed the luck check yet. Each call is recorded from the first market, wins and losses. They're a record, not trades: neither the website bot nor the app buys them. Live-price simulation, $100 a call, fees included; not advice.
The latest tradesthe newest 25 of 998, wins and losses, each checked against the order book
| Market | Signal | Bought | Left | Put in | Result | Profit | Order book a second later |
|---|---|---|---|---|---|---|---|
| #3 signal | Down at 73¢ | 9:55 | $49.84 | Down won | +$17.16 | not checked: no order book recorded then | |
| #1 signal | Down at 68¢ | 11:54 | $104.99 | Down lost | −$104.99 | filled 153 at 67.0¢ avg, −$104.88 | |
| #1 signal | Down at 80¢ | 9:01 | $104.65 | Down won | +$24.35 | filled 129 at 80.0¢ avg, +$24.35 | |
| #3 signal | Up at 67¢ | 3:28 | $49.36 | Up lost | −$49.36 | filled 77 at 63.0¢ avg, −$49.77 | |
| #1 signal | Down at 69¢ | 13:13 | $109.98 | Down lost | −$109.98 | filled 153 at 70.0¢ avg, −$109.35 | |
| #1 signal | Down at 55¢ | 13:34 | $114.60 | Down lost | −$114.60 | filled 202 at 55.0¢ avg, −$114.60 | |
| #2 signal | Down at 67¢ | 13:39 | $109.68 | Down won | +$50.32 | filled 160 at 67.0¢ avg, +$50.32 | |
| #2 signal | Down at 63¢ | 13:49 | $109.88 | Down won | +$60.12 | filled 167 at 64.0¢ avg, +$57.42 | |
| #1 signal | Down at 55¢ | 8:36 | $119.71 | Down won | +$91.29 | filled 219 at 53.0¢ avg, +$99.11 | |
| #1 signal | Down at 61¢ | 13:43 | $114.68 | Down won | +$68.32 | filled 183 at 61.0¢ avg, +$68.32 | |
| #1 signal | Down at 56¢ | 13:49 | $109.68 | Down won | +$80.32 | filled 190 at 56.0¢ avg, +$80.32 | |
| #1 signal | Down at 59¢ | 13:56 | $114.72 | Down lost | −$114.72 | filled 189 at 59.0¢ avg, −$114.72 | |
| #1 signal | Down at 66¢ | 9:57 | $119.61 | Down lost | −$119.61 | filled 175 at 66.9¢ avg, −$119.77 | |
| #1 signal | Up at 43¢ | 13:41 | $114.92 | Up won | +$142.08 | filled 251 at 44.0¢ avg, +$136.23 | |
| #2 signal | Down at 65¢ | 12:17 | $79.92 | Down won | +$40.08 | filled 121 at 64.0¢ avg, +$41.60 | |
| #2 signal | Down at 74¢ | 12:40 | $84.39 | Down won | +$27.61 | filled 114 at 73.0¢ avg, +$29.20 | |
| #2 signal | Down at 62¢ | 13:59 | $84.66 | Down lost | −$84.66 | filled 129 at 64.0¢ avg, −$84.65 | |
| #1 signal | Down at 63¢ | 9:34 | $109.88 | Down won | +$60.12 | filled 170 at 63.0¢ avg, +$60.12 | |
| #2 signal | Down at 64¢ | 11:26 | $89.89 | Down lost | −$89.89 | filled 139 at 63.0¢ avg, −$89.84 | |
| #2 signal | Down at 60¢ | 8:12 | $89.44 | Down lost | −$89.44 | filled 143 at 61.0¢ avg, −$89.62 | |
| #2 signal | Down at 75¢ | 11:43 | $94.63 | Down lost | −$94.63 | filled 122 at 76.0¢ avg, −$94.28 | |
| #1 signal | Down at 70¢ | 11:06 | $109.35 | Down won | +$43.65 | filled 153 at 70.0¢ avg, +$43.65 | |
| #1 signal | Down at 72¢ | 12:43 | $104.98 | Down won | +$38.02 | filled 144 at 71.0¢ avg, +$39.68 | |
| #2 signal | Down at 84¢ | 11:51 | $89.19 | Down won | +$15.81 | filled 105 at 84.0¢ avg, +$15.81 | |
| #2 signal | Down at 59¢ | 11:34 | $89.83 | Down won | +$58.17 | filled 155 at 56.0¢ avg, +$65.52 |
Markets not checked (the top signals could not be re-tested in time, or the bot was not running): 9. They are never traded after the fact.
Live-price simulation: real ask prices, fees included, each trade also checked against the order book a second later. Trading automated signals carries risk. The top 3 are the highest on the leaderboard with at least 30 fires since they were found or added and ahead on them by at least 1 standard error (the vetted bar: 100+ fires the bot could trade since found, ahead by 2 standard errors); fires above 85¢ are skipped (since Nov 16, 2026, above 70¢), and since Nov 5, 2026 fires under 20¢ (since Nov 8, 25¢) or with under 5 minutes left. Whole contracts (at most 300) at the asking price the signal fired at, assuming the whole order fills at that price (the order-book check drops that assumption); the exchange's taker fee, rounded up to the cent; a win pays $1 a contract. Since Nov 4, 2026 the trend guard and the cool-down apply to its new trades (never to earlier ones). Since Nov 17, 2026 there is no price floor, no top price, no trend guard and no 5-minutes-left rule on its new trades (the cool-down stays), empty places among the top 3 go to signals still being tested (10+ fires since found, ahead), and the leaderboard still judges signals on their fires at 85¢ or less. Only each signal's first fire in a market counts, so a signal that joins the top 3 mid-market may not trade until the next one. Only markets after it started count. The leaderboard only counts settled markets, so the top 3 at each second is known before the market it trades settles.
Hypothetical or simulated performance results have certain limitations. Unlike an actual performance record, simulated results do not represent actual trading. Also, since the trades have not been executed, the results may have under-or-over compensated for the impact, if any, of certain market factors, such as lack of liquidity. Simulated trading programs in general are also subject to the fact that they are designed with the benefit of hindsight. No representation is being made that any account will or is likely to achieve profit or losses similar to those shown.
Information, not advice. Every signal's record · The leaderboard